Making Sure You See What Your Radar Sees…
Mobert is now just about 10 years old and as such the Raymarine electronics that she came with are of the same vintage. We have two of the ubiquitous Classic E80 Chartplotters (MFD) and a somewhat rare (for those with E80’s) Digital Radome.
When the Classic E series (E80, E120) was released Raymarine only had Analog radar which connected directly to the chartplotter but later, along with new MFDs like E-series Wide and now the many current products (e, a, eS, gS, etc), they’ve released Digital radar, HD Digital radar, and the newest Quantum solid state radar. Interestingly, it’s not common knowledge that even the newer HD Digital radar works with the old Classic E series MFDs. Unfortunately, the Quantum Radar only works with the newest Lighthouse powered MFDs. All this to say that just because you have an older MFD doesn’t mean you can’t use one of the newer radomes with better technology. The primary difference is how they connect to the MFD–the analog radar had a special cable, while the Digital and HD Digital connect via SeatalkHS (now called RayNet) which is Raymarine’s custom version of Ethernet.
Anyway, back to the topic at hand, how can we use Radar with the chartplotter to make navigating both easier and safer. And can we actually trust what we see on the screen entirely (hint: the answer is NO).
In the last couple years of owning Mobert I’ve been experimenting with various features of our E80, and one of my favorite features is Radar Overlay. I’ve been using Radar Overlay almost religiously while we navigate for a couple of reasons…
- It allows me to see the full chart data while also seeing the radar returns without switching screens/pages. I don’t like having to give up the navigation (chart view) in order to avoid a collision (radar view) and vice-versa.
- It allows me to compare the chart shorelines and features to radar returns to verify chart accuracy. If you’ve spent any time with GPS enabled chartplotters you know that your own GPS location is FAR more accurate than the GPS coordinates of the actual chart features. So you can’t rely entirely on the charts, you need to look around and verify that what you see on the chart matches what you see in real life.
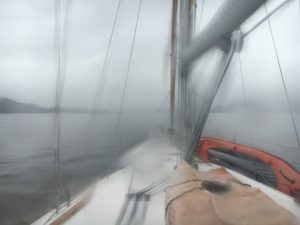
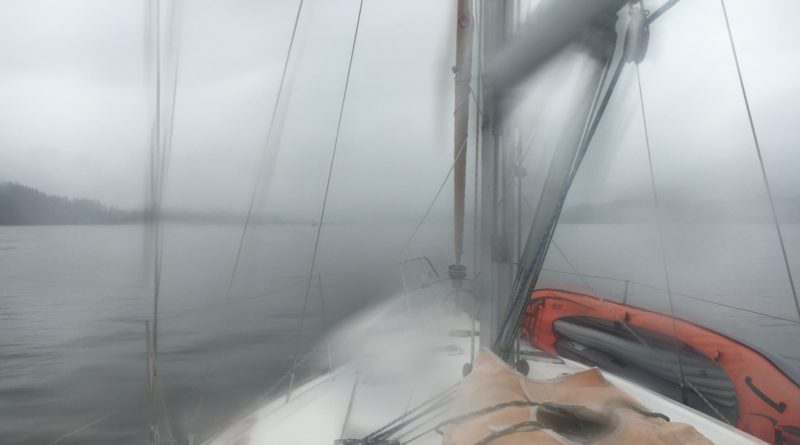
This all sounds good, but over time I’ve found that the charts have sufficient clutter with soundings, bottom anchoring conditions, marker details, ferry routes, shipping lanes, etc that small little pink/purple dots that actually represent boats get lost in the chart. The land shows up well, but the important things like moving vessels can go unseen. Let’s take this foggy and rainy day as an example. It’s difficult to see other boats as well as the land features through the mist and fog.
So we periodically check the chartplotter to see where we are headed and of course we can easily see our position relative to the shore, making it possible to navigate through the channel to our destination.
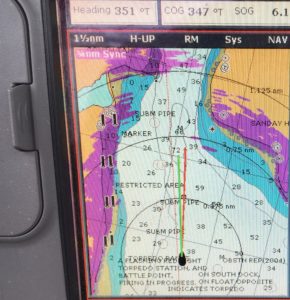
But did you notice the boat 1000 feet in front of us? No? Neither did I. If you look really close you can see a little pink dot touching the red dotted line inside the closest range ring. How do you expect to avoid boats in the fog looking for those little pink dots from 6 feet away from an 8 inch screen while also looking out ahead of you to ensure you don’t hit something that you CAN see through the fog?
So what can we do to make it better? Well, we can look at the radar view without the charts underneath and you see something like this.
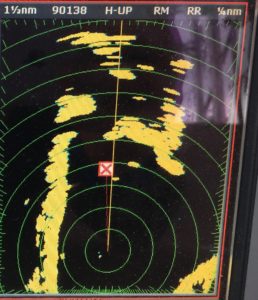
So maybe you can see that little yellow dot to our left. But is that a threat? Is it getting closer or farther away? Is it a rock, a boat, or a buoy? Without the chart data, it’s hard to know if that’s a charted object or a moving one.
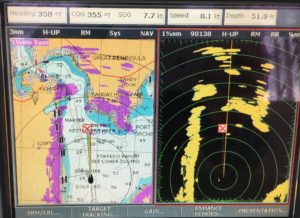
So we can display them side by side at the same time, to get some level of context. And now you can see that the yellow dot doesn’t have a corresponding mark on the chart. Great, so I know it’s not a charted object, but I still don’t know if it’s getting closer or moving away, or moving at all for that matter.
The good news is that the Raymarine radar has a few handy features to enhance your ability to interpret the information. My favorite of those features is “Wakes”. Turn “Wakes” on by going to “Enhance Echos…” menu and setting “Wakes” to on. You can set how long the wakes are (in minutes of time) to help reduce clutter that lots of movement can create in some conditions.
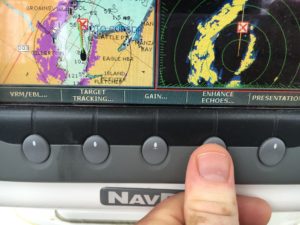
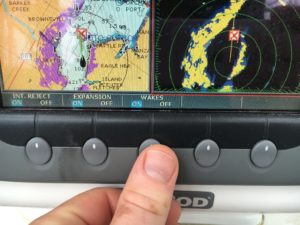
And now if you go back to that boat I talked about earlier that was 1000 feet ahead of us, it becomes really easy to see that this boat is moving toward us and is clearly a moving object.
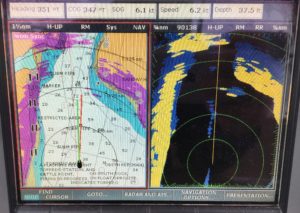
And here’s a view with several boats maneuvering in several directions around us.
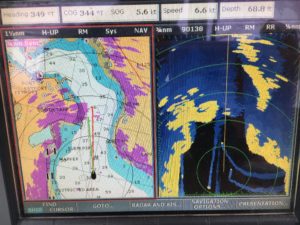
I’ve become accustomed to leaving our E80 display in split screen like this with radar overlay on the chart view and wakes on the radar view so I can easily see both how accurate the chart is as well as who is moving around me that might be a hazard.
There are certainly other fancy features available but I’ve found that this view is pretty good for quickly assessing the situation around our boat in low visibility situations.
As an aside, we also have an AIS transceiver (you should too) and I enabled AIS overlay on both sides of the screen. And that boat on the radar was also showing up on AIS, which looks like this:
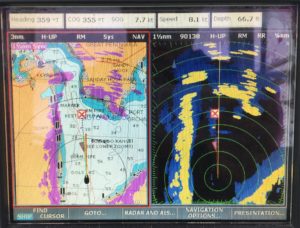
The AIS triangle that represents the other boat is even highlighted in red because the chartplotter recognizes that it’s on a collision course with us, using the speed and heading data it receives from the AIS, which is directly sent by the other vessel. When, not if, you purchase your AIS equipment, it will likely be Class-B (Class-A is generally for commercial vessels) but be sure to get a transceiver, not just a receiver. The same cool AIS technology that lets you see other boats also helps them see you, allowing ferry’s, ships, tugs, and other AIS equipped vessels to maneuver around you or call you directly if there could be a collision. If you only have a receiver, they won’t see you.
Do you have any handy tips for using radar effectively?

-390x205.jpg)